
Hello, people out there,
I hope you all are doing good. As part of our learning pandas series, today, we are going to learn about graphs and visualization of our data. The graphs are very useful when we work on presentations and explain our data to others, also non-technical people get better ideas when we show them on graphs rather than a large amount of data. So let’s get started, but first, if you have not yet check out the basics of pandas, go for Pandas in Python – Part 1 and if you want to learn how to get expected information with pandas, then check out Pandas in Python – Part 2.
Let’s create the dataset and plot them on the graph.
df = pd.DataFrame({'x': [10, 8, 10, 7, 7, 10, 9, 9],
'y': [10, 4, 5, 5, 7, 10, 9, 9]})
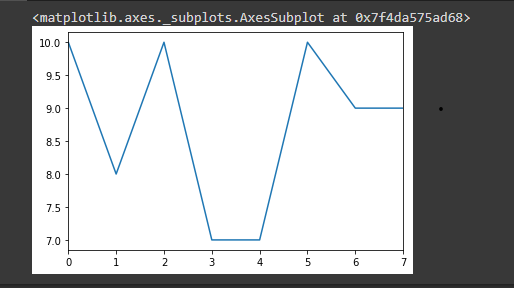
df.plot()Output,

Here it plots a simple graph according to x and y data, now, if you want to display only x data, then you can write the below line of code.
df['x'].plot()Output,
You can also display your data with a histogram graph. For that, you just need to call the hist() method.
df.hist()Output,

Just like the histogram, you can also display the data using a pie chart. For that, you need to pass argument ‘pie’ in the plot method. Let’s check that with an example.
df.plot(kind='pie', subplots=True)Output,
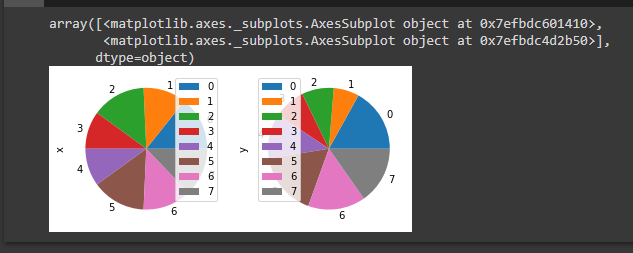
You can also get a pie chart of only ‘X’ data or only ‘Y’ data by writing the below code.
df['x'].plot(kind='pie')Output,
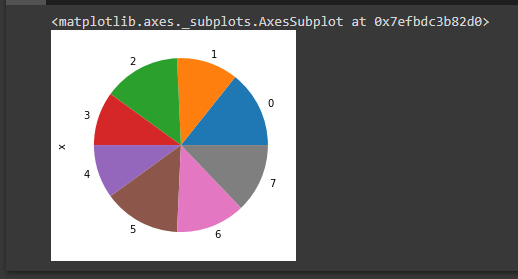
To display data with dots, you can write the below code.
df.plot(style='o')Output,
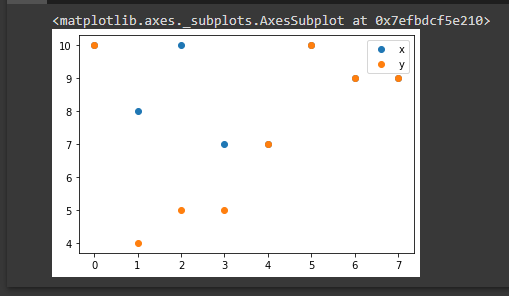
To make it more stylish you can add a border on the dots with the markeredgecolor attribute, see the example below.
df.plot(style='o', markeredgecolor='black')Output,

You can also display data with the dotted line.
df.plot(style='b--')Output,
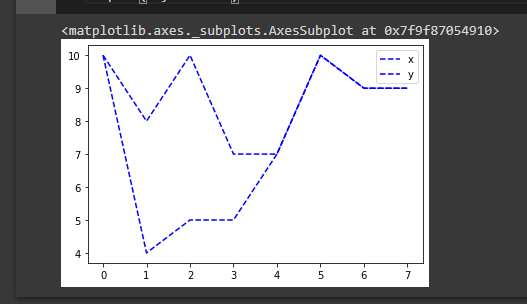
Here ‘b’ stands for the blue color, you can try out initials of your favorite color.
Now, as part of the last example, let’s learn a bit complex graph, we will display the pie chart with the percentage of all items.
import matplotlib.pyplot as plt
df = pd.DataFrame({'lable':['Building training sets', 'Cleaning and organizing data','Collecting the data', 'Mining data for patterns', 'Refraining algorithms', 'Others'],
                   'portion':[3,60,19,9,4,5]})
fig1, ax1 = plt.subplots()
ax1.pie(df['portion'], labels=df['lable'], autopct='%1.f%%',
        shadow=True)

plt.show()
Output,

I hope you have enjoyed reading this blog and learn something new. If you want to know more sub-topics of Pandas or more examples about graphs and charts, let me know in the comment section.
Thank you for reading 🙂
Happy coding 🙂
